Business Intelligence2026
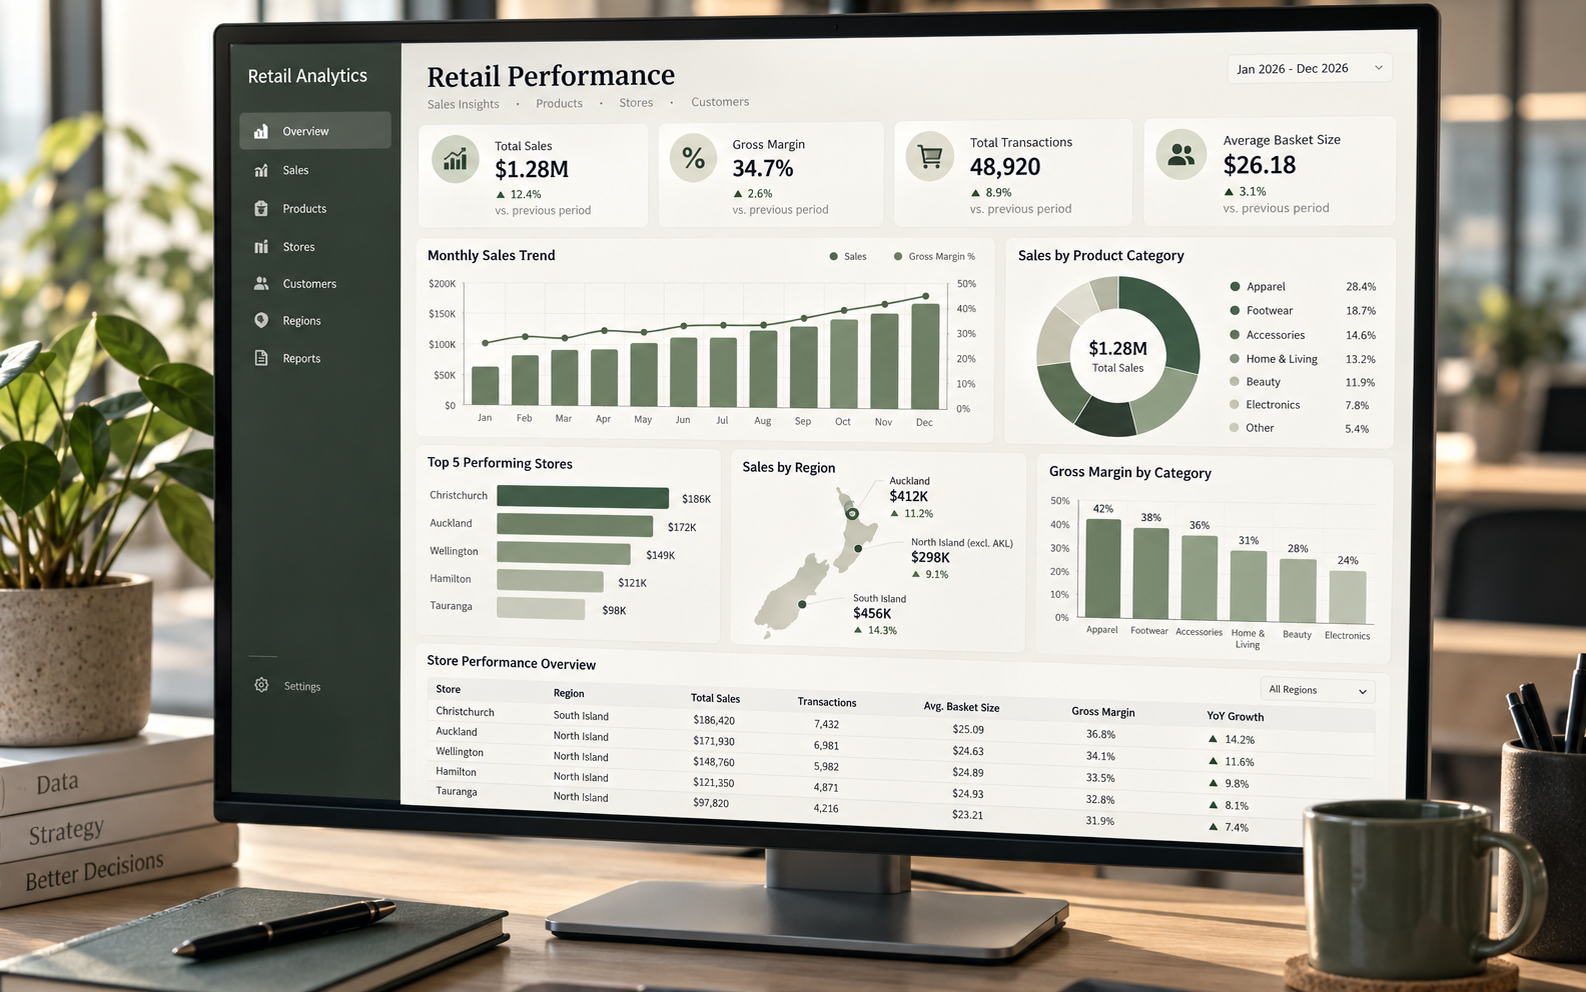
Retail Performance Dashboard
An interactive retail dashboard analysing sales, margin and store performance across a fictional multi-location business to identify trends and performance differences.
- Cleaned and structured transactional data before analysis.
- Created measures for revenue, gross margin, average transaction value and period-over-period performance.
- Built store and product-category comparisons using interactive filters.
- Designed trend views to highlight changes across months and regions.
- Summarised business findings alongside the dashboard rather than presenting charts in isolation.
OutcomeProduced an executive-style dashboard that converts transactional data into clear retail-performance indicators and comparison views.
Power BIPower QueryDAXExcelData CleaningData Visualisation